ISSN Number
ISSN 2771-019X-

-

Impact Factor
1.2*
ISSN Number
ISSN 2771-019X
Impact Factor
1.2*1Department of Cardiology, BenQ Medical Center, the Affiliated BenQ Hospital of Nanjing Medical University, Nanjing, China.
2Department of Radiology, BenQ Medical Center, the Affiliated BenQ Hospital of Nanjing Medical University, Nanjing, China.
#These authors have been equally contributed to this article.
Department of Radiology, BenQ Medical Center, the Affiliated BenQ Hospital of Nanjing Medical University, Nanjing, China.
Email: mhb_mj@126.com
Received : Jun 10, 2025,
Accepted : Jul 14, 2025
Published : Jul 21, 2025,
Archived : www.jclinmedcasereports.com
Objective: This study aimed to comprehensively evaluate the impact of relative and absolute phase acquisition protocols on motion artefacts under varying heart rates, Heart Rate Variability (HRV), and in the presence of arrhythmias.
Methods: We retrospectively reviewed data from patients who underwent CCTA using an absolute phase acquisition protocol between September and December 2024. Propensity score matching was employed to select an equal number of patients from a previous cohort scanned with a relative phase acquisition protocol. Patients with regular sinus rhythm were stratified into subgroups based on heart rate thresholds. Both subjective and objective image quality, as well as diagnostic accuracy, were assessed and compared between the two acquisition strategies.
Results: No statistically significant differences were observed in objective image quality between the two acquisition protocols. In the three sinus rhythm subgroups and the low-HRV arrhythmia subgroup, the absolute phase protocol yielded slightly higher subjective image quality scores, although the differences were not statistically significant. However, the absolute phase protocol demonstrated significantly higher subjective scores in the overall population (3.86±0.59 vs. 3.81±0.67), the cardiac arrhythmia group (3.74±0.78 vs. 3.46±1.07), and the high-HRV arrhythmia subgroup (3.73±0.80 vs. 3.63±0.89), all P<0.05. There were no significant differences in diagnostic accuracy between the two groups.
Conclusion: The absolute phase acquisition protocol significantly reduces the incidence of coronary motion artefacts, particularly in patients with arrhythmias and high HRV; however, this reduction does not translate into an improvement in diagnostic accuracy.
Keywords: Heart; Computed tomography angiography; Heart rate variability; Atrial fibrillation.
Abbreviations: CCTA: Coronary Computed Tomography Angiography; ECG: Electrocardiogram; HR: Heart Rate; HRV: Heart Rate Variability; ICA: Invasive Coronary Angiography; SA: Sinus Arrhythmia; SR: Regular Sinus Rhythm.
Copy right Statement: Content published in the journal follows Creative Commons Attribution License (http://creativecommons.org/licenses/by/4.0). © Hongbing M (2025).
Journal: The Journal of Clinical and Medical Images, Case Reports (JCMICR) is a fantastic resource for keeping up with the latest clinical advancements and for publishing case reports and clinical images related to a variety of medical illnesses.
Coronary Computed Tomography Angiography (CCTA) has gained a Class I recommendation from the European Society of Cardiology in 2020, owing to its advantages of speed, safety, efficiency, and cost-effectiveness [1]. However, a major limitation of CCTA remains the high incidence of coronary motion artefacts, particularly in patients with elevated Heart Rate (HR) and high Heart Rate Variability (HRV). These motion artefacts may obscure or mimic pathological findings, potentially leading to underdiagnosis or overtreatment [2].
In clinical practice, motion artefacts can be minimised through interventions before, during, and after the scan. Pre-scan administration of beta-blockers to reduce heart rate and HRV to target levels is strongly recommended by multiple guidelines [3-5]. However, contraindications to beta-blockers and poor therapeutic response mean that some patients are unable to achieve adequate control of heart rate and HRV. Another effective pre-scan strategy is to enhance the temporal resolution of CT scanners. Currently, 256-slice helical CT scanners offer a temporal resolution of 140 ms, allowing the heart rate threshold to be raised from the conventional 65 bpm to 70 bpm [6]. However, doubling the gantry speed increases the gravitational load fourfold, posing substantial mechanical challenges to the gantry system, which has slowed progress in this area [7]. Post-scan, motion correction algorithms—particularly second-generation motion correction algorithms—have been shown to significantly improve CCTA image quality [8,9]. Nevertheless, motion correction algorithms are typically restricted to use with scanners from specific vendors.
At present, prospectively Electrocardiogram (ECG)-triggered axial scanning is considered the preferred protocol for CCTA, as it significantly reduces radiation exposure to patients [5]. Within this protocol, two types of phase acquisition strategies—absolute and relative—are available to determine the scan initiation point. However, the extent to which each strategy affects motion artefacts remains unclear. Therefore, the aim of this study is to comprehensively evaluate the impact of relative and absolute phase acquisition protocols on motion artefacts across different heart rates, HRV levels, and in patients with arrhythmias.
This retrospective study was approved by the institutional review board, with the requirement for informed patient consent waived.
Study population
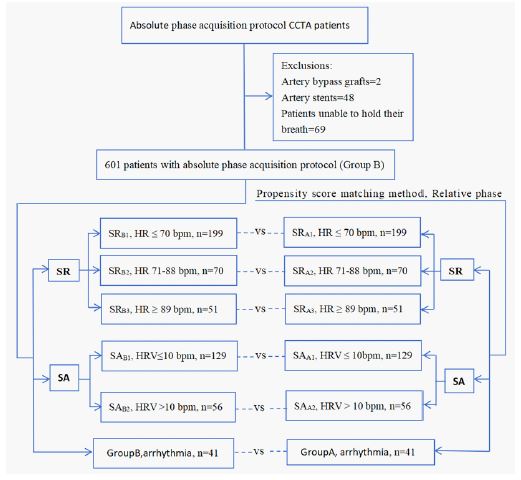
This retrospective study included patients who underwent CCTA using the absolute phase acquisition protocol between September and December 2024, with the following exclusions: (1) patients with coronary artery bypass grafts; (2) patients with coronary artery stents; and (3) patients unable to hold their breath. The patients were then grouped based on the characteristics of their ECG recordings from the CT scanner into three groups: regular sinus rhythm, sinus arrhythmia, and arrhythmia groups. Subsequently, a propensity score matching method was applied to match patients in the absolute phase acquisition group (based on gender, age, and ECG characteristics) in a 1:1 ratio with 4700 patients who had undergone CCTA with the relative phase acquisition protocol between December 2022 and August 2024 [10]. An equal number of patients from the relative phase acquisition group were selected as the control group (Group A), (Figure 1).
Scanning protocol
All patients were scanned using a 256-slice, 16 cm wide detector CT scanner (Revolution APEX CT, GE Healthcare, Milwaukee, WI, USA) in a prospectively ECG-triggered axial scanning mode, covering a Z-axis range of 16 cm with a rotation time of 0.28 seconds. During the scan, Auto Gating and Smart Phase technologies, along with deep learning reconstruction algorithms (True Fidelity, GE Healthcare) and second-generation motion correction algorithms (MCA2, GE Healthcare), were used for image reconstruction. A contrast dose of 50 ml of Omnipaque (350 mg I/ml, GE Healthcare) was injected into the left or right antecubital vein at a rate of 5 ml/s using a dual-head CT power injector (Stellant, Bayer) followed by a 30 ml saline flush at the same injection rate. No additional beta-blockers or nitrates were used in this study.
Coronary artery segmentation
In accordance with the 2014 guidelines from the Society of Cardiovascular Computed Tomography (SCCT) [11], the coronary arteries were segmented into 18 regions. The coronary arteries were divided into three main branches: the Left Anterior Descending artery (LAD), the Right Coronary Artery (RCA), and the Left Circumflex Artery (LCX). Additionally, the Left Main (LM) was classified as part of the LAD, and the Ramus Intermedius (RAMUS) was classified as part of the LCX.
Image quality assessment
Objective image quality assessment: Experienced observers measured the attenuation values and Standard Deviation (SD) at the level of the left mainstem of the ascending aorta, ensuring that the measurements were taken at the maximum vessel area, while avoiding the vessel wall, calcifications, and non-calcified plaques. Each side was measured three times, and the average value was taken. Attenuation values and SD of the pericardial fat were also measured. The SD value of the ascending aorta, Signal-to-Noise Ratio (SNR), and Contrast-to-Noise Ratio (CNR) were used to assess CCTA image noise, SNR, and CNR [11,12]. The SNR was defined as the average attenuation value of the ascending aorta divided by its standard deviation. The CNR was defined as the attenuation value within the vessel minus the attenuation value of the pericardial fat, divided by the standard deviation of the pericardial fat attenuation.
Subjective image quality assessment: Two experienced observers independently and blindly assessed the subjective image quality using the 18-segment model. In cases of scoring discrepancies between the two observers, consensus was reached through joint review. A four-point Likert scale was used to evaluate subjective image quality [13]: 4 points = Excellent (no artefacts), 3 points = Good (mild artefacts, diagnostic quality), 2 points = Acceptable (moderate artefacts, but still interpretable and diagnosable), 1 point = Unable to assess (severe artefacts rendering interpretation impossible). Scores ≥2 points were considered acceptable for diagnostic purposes, excluding segments with luminal occlusion or severe diffuse calcification.
Definition and grouping of regular sinus rhythm thresholds
Based on subjective image quality assessment, if a segment is deemed uninterpretable (scored 1 point), an intention-to-diagnose approach is used. However, if two or more segments of a single vessel are considered uninterpretable, that vessel is classified as non-diagnostic. Using a similar approach, if two or more coronary arteries in a patient are deemed uninterpretable, the coronary arteries of that patient are considered non-assessable [14]. Further, based on the subjective scores for image quality, CCTA image quality was categorised into excellent, good, and poor. Excellent image quality was defined as all coronary artery segments receiving a subjective score of 4, good image quality was defined as one coronary artery being unassessable among the three, and poor image quality was defined as two or more coronary arteries being unassessable. Using the excellent, good, and poor image quality classifications, the threshold for regular sinus rhythm was determined using the Youden’s index. Patients were then further stratified into subgroups based on this threshold.
Assessment of coronary artery stenosis severity
Two experienced observers, blinded to the results of Invasive Coronary Angiography (ICA), visually assessed all CCTA segments on a dedicated workstation (ADW4.7, GE Healthcare, Waukesha, WI, USA). The severity of luminal stenosis was evaluated as a percentage of the vessel diameter, with analysis performed in at least two planes: one parallel to the vessel and one perpendicular to the vessel’s axis. If there was a disagreement between the two observers, a consensus decision was made. Stenosis severity was graded according to the stenosis classification scale recommended by the 2014 SCCT guidelines [15], with positive segments defined as those showing ≥50% luminal stenosis. In cases of multiple stenoses within the same segment, the segment with the most severe stenosis was classified. All coronary artery segments were analyzed, including those with a diameter of <1.5 mm, but excluding distal segments of occluded vessels. Additionally, segments scored as 1 point were considered positive for stenosis (≥50% luminal stenosis).
ICA
ICA was performed using standard techniques on an INNOVA 3100 system (GE Healthcare, Waukesha, Wisconsin), and multiple views were stored. Coronary angiography was independently and blindly assessed by two observers who were unaware of the CCTA results. In cases of disagreement between the two observers, a consensus decision was reached during a joint review. The definition of coronary artery segments and the assessment of stenosis severity were the same as described above.
Statistical analysis
The normality of variables was assessed using the Kolmogorov-Smirnov test. Continuous variables were expressed as mean ± standard deviation and analyzed using independent samples t-test. Non-normally distributed variables were expressed as median interquartile range and analyzed using the Mann-Whitney U test. Categorical data were presented as frequency distributions, and differences in categorical data were assessed using the chi-squared test. Inter-observer agreement was evaluated using the Kappa test. Sensitivity, specificity, Positive Predictive Value (PPV), Negative Predictive Value (NPV), and accuracy of CCTA for detecting positive lesions (≥50% stenosis) were calculated based on each segment, each vessel, and each patient, using ICA results as the reference standard. Non-diagnostic segments (scored 1 point) were also included in the analysis and considered positive. All statistical analyses were performed using SPSS 20.0 (Chicago, IL, USA), with a two-tailed P value <0.05 considered statistically significant.
Basic patient characteristics
Two patients with a history of bypass surgery, 48 with coronary stent implantation, and 69 who were unable to hold their breath were excluded. A total of 601 patients who underwent CCTA using the absolute phase acquisition protocol were included, of whom 55 underwent both CCTA and ICA within one month. Simultaneously, a matched cohort of patients using the relative phase acquisition protocol was selected in equal numbers. There were no statistically significant differences between the two protocols in terms of gender, age, height, weight, body mass index, HR, and HRV across the sinus rhythm group, sinus arrhythmia group, and arrhythmia group (Table 1).
Subgroup stratification
Based on the Youden’s index of subjective CCTA scoring for regular sinus rhythm, the threshold for excellent and good heart rates was 70.5 bpm, while the threshold for good and poor heart rates was 88.5 bpm. Using these HR thresholds, regular Sinus Rhythm (SR) was further divided into three subgroups: SR1, HR ≤70 bpm; SR2, HR 71-88 bpm; SR3, HR ≥89 bpm. Additionally, HRV was used with a cutoff of 10 bpm to divide the Sinus Arrhythmia (SA) group into two subgroups: SA1, HRV ≤10 bpm; SA2, HRV >10 bpm (Figure 1).
Image quality assessment
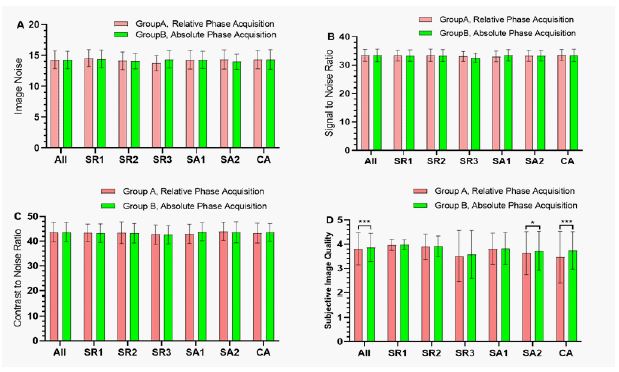
Objective image quality assessment: There were no statistically significant differences in image noise, SNR, and CNR between the relative and absolute phase acquisition protocols across the entire cohort, the sinus rhythm group, the sinus arrhythmia group, and the arrhythmia group (Figure 2A-C).
Subjective image quality assessment: The subjective scores for the absolute phase acquisition protocol were significantly higher than those for the relative phase acquisition protocol in the entire cohort (3.86±0.59 vs 3.81±0.67) and the Cardiac Arrhythmia group (3.74±0.78 vs 3.46±1.07), with both comparisons showing P<0.001. In the high sinus arrhythmia subgroup - SA2 (3.73±0.80 vs 3.63±0.89), the absolute phase acquisition protocol was slightly superior to the relative phase acquisition protocol, with P=0.03. In the three subgroups of regular sinus rhythm, SR1 (3.98±0.20 vs 3.97±0.22), SR2 (3.91±0.43 vs 3.89±0.53), SR3 (3.57±1.06 vs 3.51±0.99), and the low sinus arrhythmia subgroup - SA1 (3.82±0.66 vs 3.81±0.65), the subjective scores for the absolute phase acquisition protocol were slightly higher than those for the relative phase acquisition protocol, but no significant differences were observed, with all comparisons showing P>0.05 (Figure 2D).
Further analysis revealed that the affected segments were primarily located in Diagonal 1(D1), LAD distal (LAD3), RCA mid (RCA2), Left Circumflex Distal (LCX2), and Obtuse Marginal 1(OM1), as shown in Appendix Table 1.
Diagnostic accuracy assessment
A total of 55 patients were included in each group for both the absolute and relative phase acquisition protocols. When non-diagnostic segments were included, the diagnostic accuracies based on patient, vessel, and segment for the relative phase acquisition protocol were 94.5%, 91.5%, and 95.8%, respectively, while for the absolute phase acquisition protocol, the diagnostic accuracies were 94.5%, 87.3%, and 95.3%, with no statistically significant differences between the two groups (all P>0.05), (Table 2). When non-diagnostic segments were excluded, the diagnostic accuracies for the relative phase acquisition protocol were 96.4%, 92.4%, and 98.4%, respectively, while for the absolute phase acquisition protocol, the diagnostic accuracies were 96.4%, 90.9%, and 97.4%, with no statistically significant differences between the two groups (all P > 0.05), (Table 3).
| Parameter | Category | Sinus RhythmGroup | Sinus Arrhythmia Group | Cardiac ArrhythmiaGroup, n=41 | |||
|---|---|---|---|---|---|---|---|
| HR≤70bpm,n=199 | HR71-88 bpm, n=70 | HR≥89bpm,n=51 | HRV≤10 bpm,n=129 | HRV 10 bpm,n=56 | |||
| Age (years) | Relative Phase | 59.2±11.5 | 57.7±12.5 | 53.1±13.6 | 53.4±12.7 | 55.1±16.6 | 62.9±13.8 |
| Absolute Phase | 59.1±11.5 | 58.1±12.5 | 53.9±15.9 | 53.3±12.8 | 55.3±15.4 | 62.6±13.5 | |
| P value | 0.944 | 0.888 | 0.785 | 0.953 | 0.936 | 0.922 | |
| Female (%) | Relative Phase | 46.2% | 52.8% | 37.2% | 37.9% | 42.8% | 46.3% |
| Absolute Phase | 46.2% | 52.8% | 37.2% | 37.9% | 42.8% | 46.3% | |
| P value* | 1.000 | 1.000 | 1.000 | 1.000 | 1.000 | 1.000 | |
| Height (cm) | Relative Phase | 165.7±7.9 | 165.3±8.3 | 166.6±8.1 | 166.5±8.1 | 164.9±8.4 | 166.9±8.5 |
| Absolute Phase | 165.6±8.1 | 163.4±7.9 | 166.3±8.6 | 167.1±8.2 | 164.7±8.1 | 165.4±9.4 | |
| P value | 0.846 | 0.182 | 0.860 | 0.644 | 0.892 | 0.435 | |
| Weight (kg) | Relative Phase | 68.2±11.5 | 68.7±14.9 | 69.8±14.9 | 69.0±13.2 | 67.1±14.8 | 68.9±13.9 |
| Absolute Phase | 68.3±11.6 | 67.5±13.4 | 69.8±13.2 | 69.3±13.9 | 66.7±12.3 | 69.3±13.8 | |
| P value | 0.928 | 0.630 | 0.994 | 0.886 | 0.890 | 0.918 | |
| BMI(kg/m2) | Relative Phase | 24.7±3.2 | 24.9±4.3 | 25.0±4.5 | 24.7±3.7 | 24.4±4.2 | 24.5±3.4 |
| Absolute Phase | 24.8±3.3 | 25.1±3.8 | 25.0±3.7 | 24.8±3.9 | 24.4±3.1 | 25.2±3.9 | |
| P value | 0.744 | 0.799 | 0.987 | 0.857 | 0.998 | 0.391 | |
| HR(bpm) | Relative Phase | 61.3±5.6 | 76.8±4.5 | 96.8±8.1 | 71.1±9.7 | 73.2±11.1 | 75.4±16.0 |
| Absolute Phase | 61.4±5.4 | 77.2±4.7 | 94.6±5.8 | 71.2±9.6 | 72.6±8.2 | 71.5±15.0 | |
| P value | 0.938 | 0.689 | 0.124 | 0.923 | 0.723 | 0.252 | |
| HRV (bpm) | Relative Phase | 3.2±1.3 | 3.4±1.2 | 3.2±1.3 | 7.5±1.3 | 17.1±7.2 | 22.8±16.1 |
| Absolute Phase | 2.9±1.3 | 3.2±1.2 | 3.1±1.4 | 7.3±1.2 | 15.6±5.4 | 27.2±17.2 | |
| P value | 0.063 | 0.497 | 0.617 | 0.136 | 0.257 | 0.234 | |
Values are represented as mean±SD or % (n/N)
*=Chi-Square test; BMI: Body mass index; HR: Heart rate; HRV: Heart rate variability.
| Parameter | Group | Score 1 | TP | TN | FP | FN | Sensitivity | Specificity | PPV | NPV | Accuracy |
|---|---|---|---|---|---|---|---|---|---|---|---|
| Per patient | Group A | 1 | 42 | 10 | 2 | 1 | 0.977 | 0.833 | 0.955 | 0.909 | 0.945 |
| Group B | 1 | 40 | 12 | 1 | 2 | 0.952 | 0.923 | 0.976 | 0.857 | 0.945 | |
| P-value | 0.935 | 0.861 | 0.944 | 0.920 | 1.000 | ||||||
| Per vessel | Group A | 4 | 84 | 67 | 9 | 5 | 0.944 | 0.882 | 0.903 | 0.931 | 0.915 |
| Group B | 6 | 67 | 77 | 10 | 11 | 0.859 | 0.885 | 0.870 | 0.875 | 0.873 | |
| P-value | 0.676 | 0.986 | 0.868 | 0.789 | 0.767 | ||||||
| Per segment | Group A | 22 | 122 | 676 | 27 | 8 | 0.938 | 0.962 | 0.819 | 0.988 | 0.958 |
| Group B | 17 | 102 | 661 | 24 | 14 | 0.879 | 0.965 | 0.810 | 0.979 | 0.953 | |
| P-value | 0.725 | 0.964 | 0.950 | 0.905 | 0.936 |
TP: True Positive; TN: True Negative; FP: False Positive; FN: False Negative; PPV: Positive Predictive Value; NPV: Negative Predictive Value; Group A: Relative Phase Acquisition Protocol, n: 55; Group B: Absolute Phase Acquisition Protocol, n: 55.
The Kappa values for subjective image quality were 0.873 and 0.904, indicating almost perfect agreement between the observers. The Kappa value for the CCTA stenosis rate analysis was 0.779, and for the ICA stenosis rate analysis, the Kappa value was 0.769, suggesting substantial agreement between the observers (Table 3).
| Reader A | Reader B | Kappa Value | |
|---|---|---|---|
| Subjective scoring (4/3/2/1) | |||
| Group A | 7976/155/172/361 | 7938/172/146/408 | 0.873 |
| Group B | 8128/73/106/321 | 8152/61/122/293 | 0.904 |
| Stenosis analysis | |||
| CCTA (Positive/negative) | 279/1355 | 273/1361 | 0.779 |
| ICA (Positive/negative) | 249/1385 | 243/1391 | 0.769 |
CCTA: Coronary Computed Tomography Angiography; ICA: Invasive Coronary Angiography; Group A: Relative Phase Acquisition Protocol; Group B: Absolute Phase Acquisition Protocol.
The results of this study indicate that, compared to the relative phase acquisition protocol, the absolute phase acquisition protocol significantly reduces the incidence of coronary artery motion artifacts, particularly in patients with arrhythmias and high HRV. However, this did not translate into an improvement in diagnostic accuracy.
The prospectively ECG-triggered axial scanning mode is the preferred acquisition technique for CCTA, as it significantly reduces patients’ radiation exposure [5]. However, it is particularly susceptible to coronary motion artefacts, especially in patients with irregular heart rhythms. This is because the optimal data acquisition timing within a given R–R interval relies on accurate prediction of the duration of the upcoming R–R interval [16]. Moreover, as HR increases, the diastolic phase progressively shortens while the systolic phase remains relatively stable [17]. Consequently, the acquisition window in prospective ECG-triggered axial scanning is heavily dependent on HR [18-20]. However, in patients with irregular rhythms—such as sinus arrhythmia or arrhythmias—accurately determining the optimal acquisition window becomes increasingly challenging.
The prospective ECG-triggered axial scanning mode has two phase acquisition protocols: the absolute phase acquisition protocol and the relative phase acquisition protocol, both of which are used to determine the starting point of the acquisition window. The absolute phase acquisition protocol starts timing from the R-wave onset, determining the trigger start time based on the HR, and is represented in milliseconds. The relative phase acquisition protocol calculates and determines the start time of data collection as a percentage, based on several R-R intervals recorded from the ECG prior to data collection. For regular sinus rhythm, there should be no difference between the two acquisition protocols, as the start time is determined by the HR. However, in cases of irregular heart rates, such as in patients with high HRV, the large changes in R-R intervals before and during data collection make it difficult to select an accurate time window when using the relative phase acquisition protocol. On the other hand, when using the absolute phase acquisition protocol, the impact of HRV on time window selection is significantly reduced. This is because the absolute phase acquisition protocol starts timing from the R-wave onset and does not require reference to the pre-recorded ECG data, only being affected by the ECG during data acquisition. Additionally, when HRV changes during data collection, only the diastolic phase is affected, as the diastolic period significantly shortens when the HR exceeds 65 bpm, while the systolic period remains relatively stable. The results of this study indicate that, compared with the relative phase acquisition protocol, the absolute phase acquisition protocol significantly reduces coronary artery motion artifact occurrence in patients with arrhythmia and high HRV, but has no effect in patients with regular sinus rhythm. Therefore, for patients with arrhythmia and high HRV, the absolute phase acquisition protocol should be preferred in the prospective ECG-triggered axial scanning mode to achieve diagnostic-quality images.
To the best of our knowledge, we are the first to comprehensively evaluate the impact of two-phase acquisition protocols on motion artifacts. In our study, we defined the threshold for regular sinus rhythm based on excellent, good, and poor image quality, using the Youden Index to determine the HR threshold. However, it is much more challenging and complex to define how HRV should be categorized. Hoffmann et al. [21] demonstrated that with a 16-slice spiral CT scanner, CCTA image quality significantly decreased when HRV exceeded 10 bpm. Similarly, Chen et al. [22] reported that with a 16 cm wide-body CT scanner, CCTA image quality slightly decreased when HRV was greater than 10 bpm. Therefore, in our study, we used an HRV threshold of 10 bpm as a reference to assess the results in patients with higher HRV. Our study also found that objective CCTA image quality, such as noise, SNR, and CNR, was not related to HR or HRV. This finding is consistent with the results of Schoepf et al. [23].
The absolute phase acquisition protocol significantly reduces the occurrence of coronary motion artifacts, though whether this translates into an improvement in diagnostic accuracy requires further investigation. The study results indicate that, regardless of whether non-diagnostic segments are included, the diagnostic accuracy based on patients, vessels, and segments is similar for both relative and absolute phase acquisition protocols, with no statistically significant differences. Further analysis revealed that non-diagnostic segments were mainly located in D1, LAD3, LCX2, and OM1. These segments are predominantly found in the distal and smaller branches of the coronary arteries, with diameters often less than 1.5mm. From a pathophysiological perspective, these artifacts are less critical and can be effectively controlled through pharmacological treatment [7]. Although these non-diagnostic segments can reduce image quality, their contribution to diagnostic accuracy is limited, as coronary plaques primarily occur in the larger proximal and mid-segments of the coronary arteries, with a lower incidence in the distal regions [10]. In this study, the diagnostic accuracy based on patients, vessels, and segments for the absolute phase acquisition protocol was 96.4%, 90.9%, and 97.4%, respectively. These results are comparable to those of Liang et al. [24], who reported diagnostic accuracy of 95.3%, 94.9%, and 95.3% at the patient, vessel, and segment levels under the same equipment conditions, and significantly higher than Xu et al. [12], who obtained a 91.2% accuracy at the segment level. The results also surpass those obtained using dual-source CT (91.9% accuracy at the segment level) [25] and those from Linde et al. [26], who achieved 89% accuracy at the patient level using a 320-row multi-detector CT scanner.
Limitations
This study has several limitations.
1. The study results were obtained using the GE Healthcare 256-slice, 16 cm wide detector CT scanner and GE’s specific second-generation motion correction algorithm. The effectiveness of these results on other devices requires further investigation.
2. Due to limited data, HRV was assessed with a threshold of 10 bpm to evaluate the impact of the two-phase acquisition protocols on the occurrence of motion artifacts. Future studies should collect more data to further assess the impact of phase acquisition protocols on motion artifacts under varying heart rates and HRV conditions.
3. This study is a single-centre study with valid ICA data; therefore, multi-centre and large-scale studies are required for further validation.
In patients with arrhythmias and high HRV, the absolute phase acquisition protocol significantly reduces the occurrence of coronary motion artifacts, but it has no effect on patients with regular sinus rhythm. Furthermore, the reduction in motion artifacts did not translate into an improvement in diagnostic accuracy. It is recommended to adopt the absolute phase acquisition protocol when using prospective ECG-triggered axial scanning, as it enhances image quality and facilitates the broader application of CCTA to all patient populations, thereby overcoming the limitations imposed by low and regular sinus heart rates.
Clinical relevance
The absolute phase acquisition protocol reduces coronary motion artefacts, especially in patients with arrhythmia and high HRV, without improving diagnostic accuracy.
Key Points
• High HRV is one of the primary contributors to increased coronary motion artefacts.
• The absolute phase protocol reduces coronary motion artefacts in arrhythmic patients with high HRV.
• When using prospective ECG-triggered axial scanning, the absolute phase acquisition protocol is preferred to enhance image quality.
Acknowledgments: We would like to express our gratitude to Dr. Shuai Zhang, and Dr. Aiyun Sun from the GE medical team for the support of this research.
Reporting checklist: The authors have completed the STROBE reporting checklist.
Conflicts of interest: All authors have completed the ICMJE uniform disclosure form. All authors have no conflicts of interest to declare.
Ethical statement: The authors are accountable for all aspects of the work in ensuring that questions related to the accuracy or integrity of any part of the work are appropriately investigated and resolved. The study was conducted in accordance with the Declaration of Helsinki (as revised in 2013). The study was approved by the ethics committee of Affiliated BenQ Hospital of Nanjing Medical University (No. 2022-KL002) and all subjects provided written informed consent before participating in the study.
RCA1: RCA, proximal; RCA2: RCA, mid; RCA3: RCA, distal; R-PDA: Right posterior descending artery; LM: Left main; RAMUS: Ramus Intermedius; LAD1: LAD, proximal; LAD2: LAD, mid; LAD3: LAD, distal; D1: Diagonal 1; D2: Diagonal 2; LCX1: Left circumflex, proximal; OM1: Obtuse marginal 1; LCX2: Left circumflex, distal; OM2: Obtuse marginal 2; L-PDA: Left posterior descending artery; R-PLB: Right posterior-lateral branch; L-PLB: Left posterior-lateral branch.
TP: True Positive; TN: True Negative; FP: False Positive; FN: False Negative; PPV: Positive Predictive Value; NPV: Negative Predictive Value; Group A: relative phase acquisition protocol, n: 55; Group B: Absolute phase acquisition protocol; n: 55.
Group A Exclusions
Coronary artery stents: 40 segments (LAD1=7, D1=1, LAD2=9, RCA1=4, RCA2=7, RCA3=2, LCX1=6, LCX2=4)
Calcifications: 11 segments (LAD1=6, RCA1=3, RCA3=1, LCX1=1)
Occlusions: 32 segments (LAD2=1, LAD3=1, RCA1=3, RCA2=9, RCA3=3, R-PDA=4, R-PLB=3, LCX1=3, LCX2=5)
Deficiencies: 2,071 segments (RUMS=370, D1=3, LAD2=1, D2=170, LAD3=3, RCA3=23, R-PDA=20, R-PLB=24, LCX1=4, LCX2=22, OM1=14, OM2=278, L-PDA=571, L-PLB=568)
A total of 8,664 segments were included, with a score distribution of 7,952 / 163 / 160 / 389.
Group B Exclusions
Coronary artery stents: 33 segments (LAD1=12, D1=1, LAD2=9, RCA1=1, RCA2=7, LCX1=2, LCX2=1)
Calcifications: 2 segments (LAD2=1, RCA1=1)
Occlusions: 4 segments (LAD1=1, LAD2=1, RCA2=1, LCX1=1)
Deficiencies: 2,151 segments (RUMS=389, LAD1=2, D1=1, LAD2=1, D2=225, LAD3=1, RCA1=1, RCA2=1, RCA3=6, R-PDA=16, R-PLB=13, LCX1=5, LCX2=6, OM1=3, OM2=307, L-PDA=588, L-PLB=586)
A total of 8,628 segments were included, with a score distribution of 8,141 / 68 / 113 / 306.